Trends and node data
History is read from the backend set in History.
Trends
Energy Flow › Trends. Site totals from the Balance: grid import and export, solar, battery, home, self-sufficiency, and a per-day table.
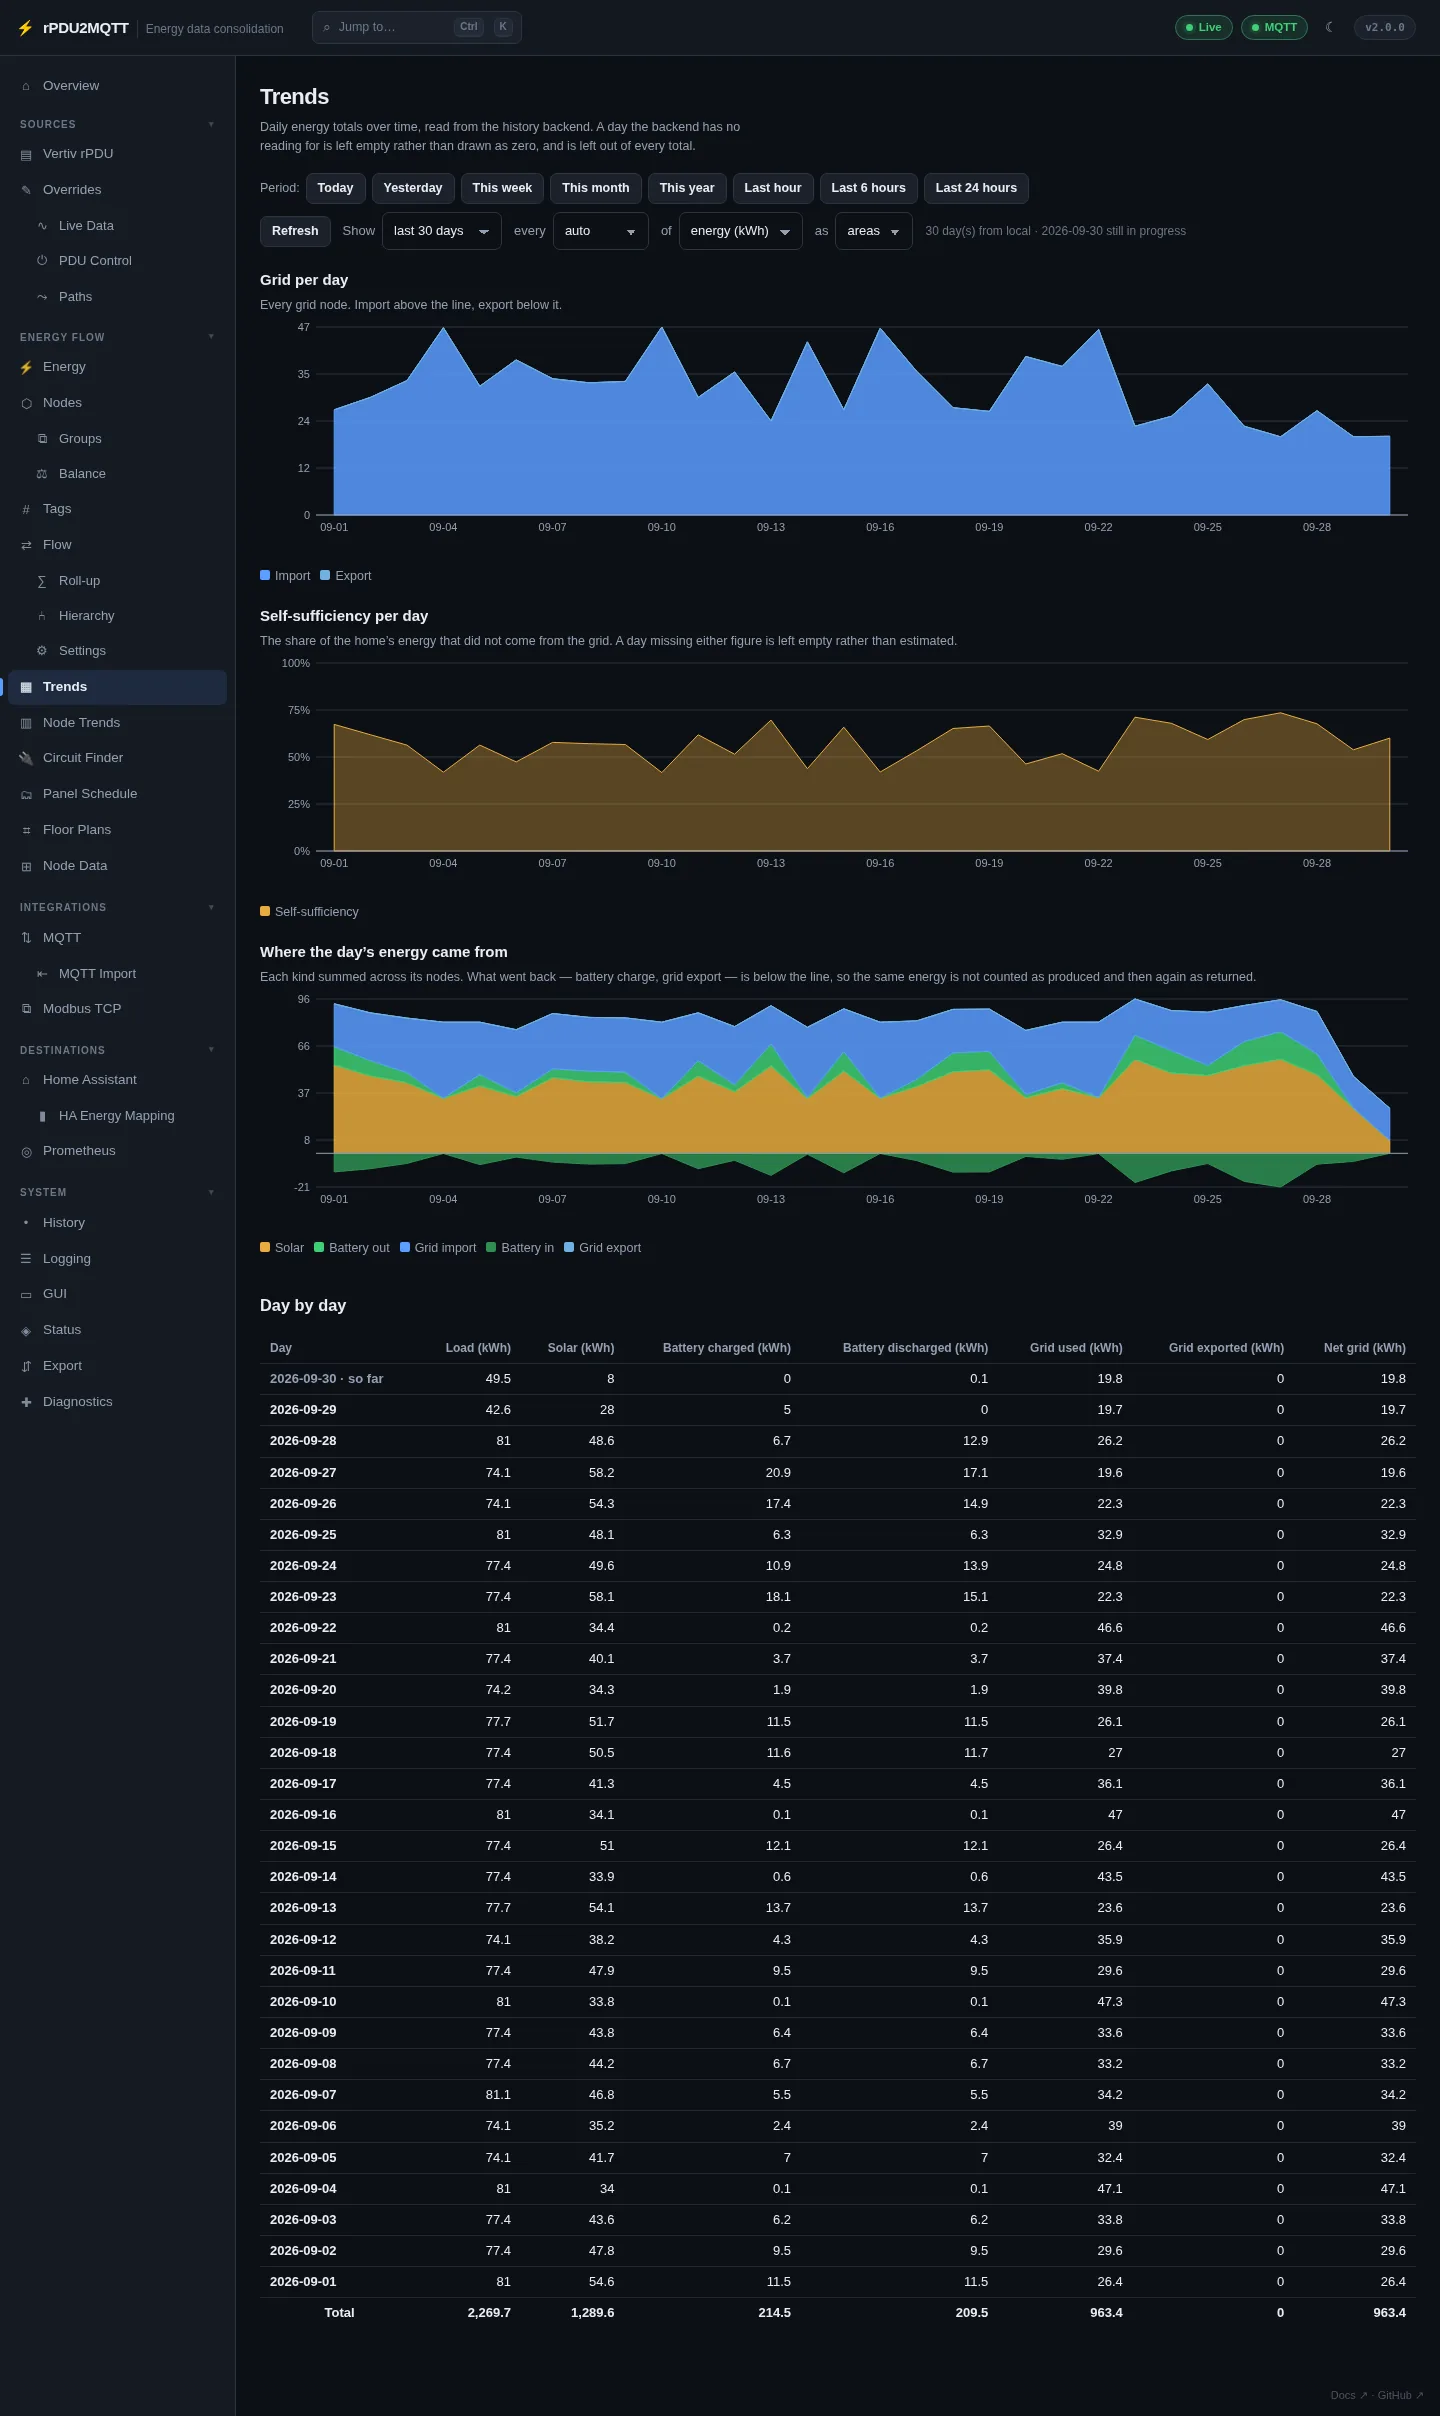
| Control | Options |
|---|---|
| Period | Today, Yesterday, This week, This month, This year, Last hour, Last 6 hours, Last 24 hours |
| Show | Today so far through last 90 days |
| Every | auto, 1 min to 12 hours, per day |
| Of | power (W), energy (kWh), cost ($) |
| As | bars, lines, areas |
A day with no reading is empty, not zero, and is left out of totals.
Node Trends
Energy Flow › Node Trends. Any set of nodes over time.
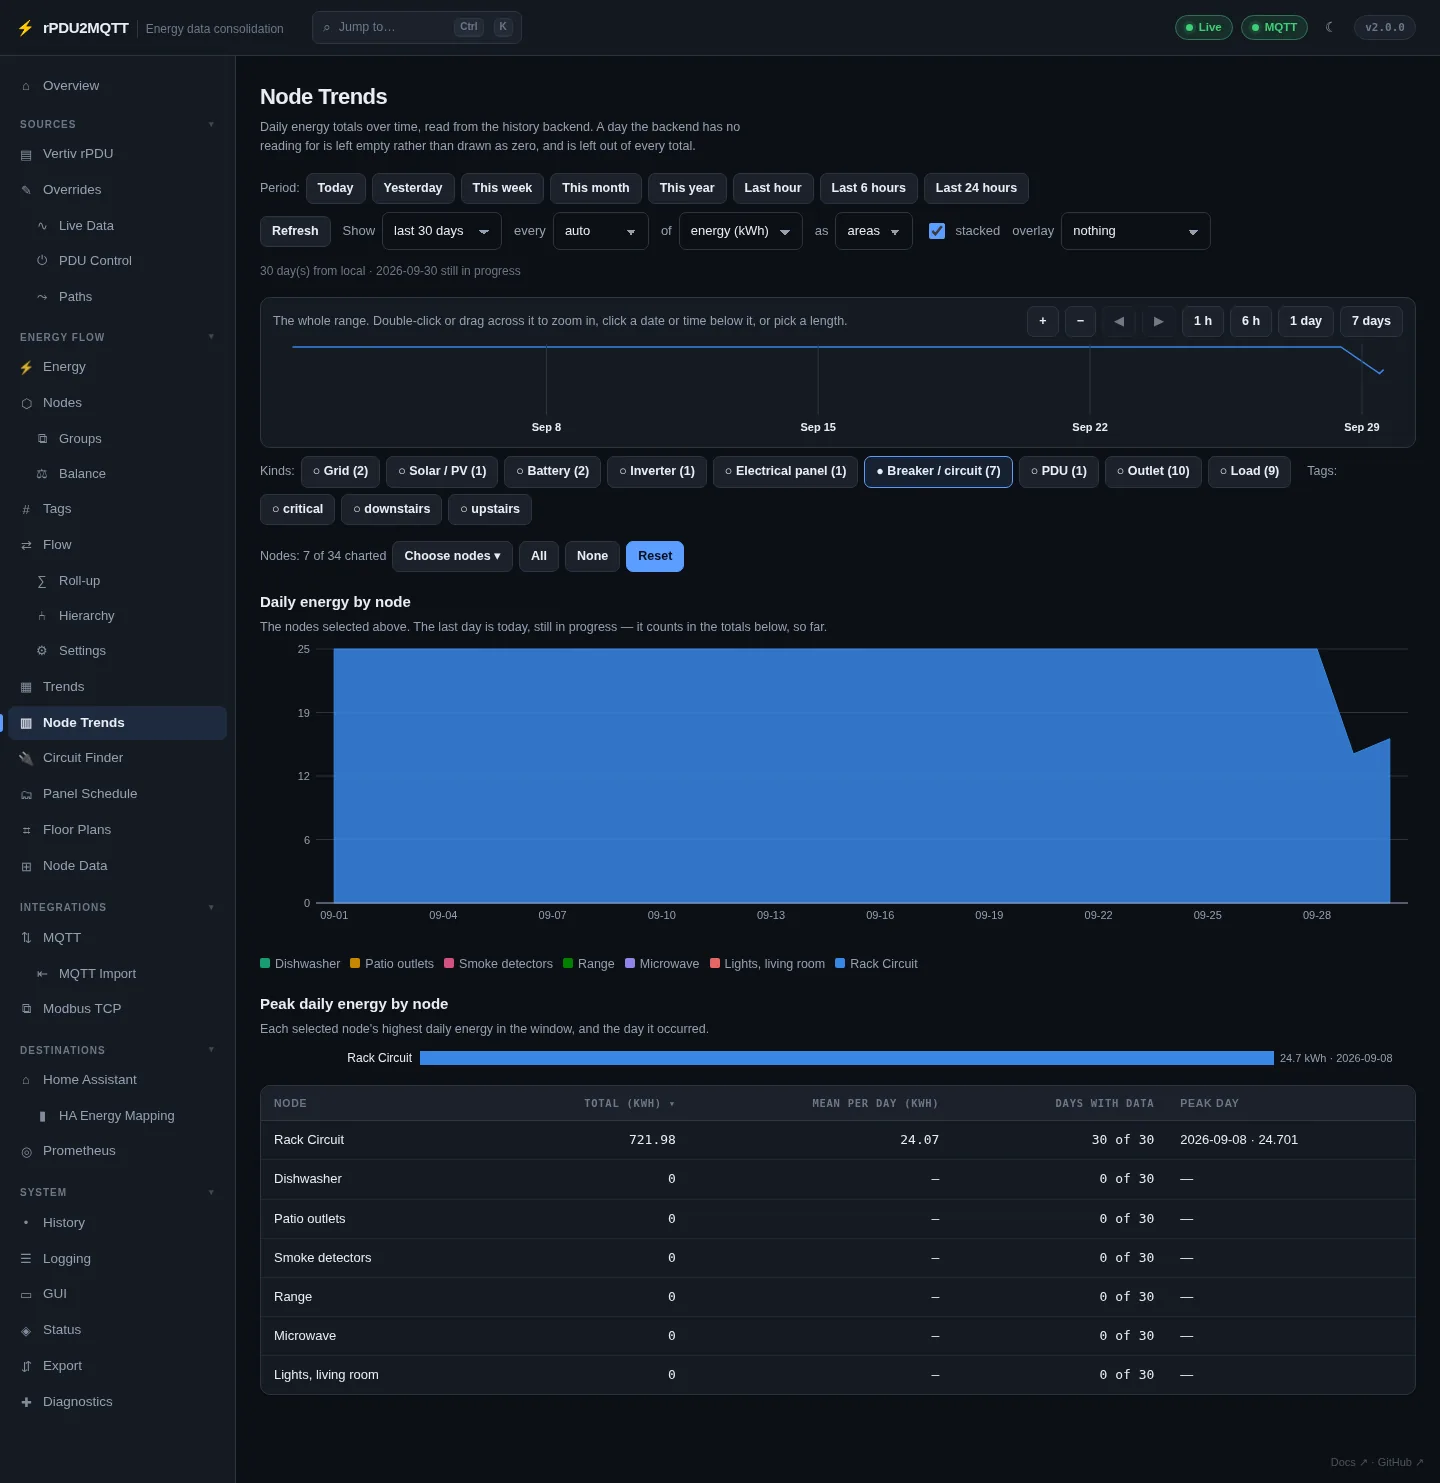
- Filter by Kinds and Tags, or Choose nodes.
- stacked stacks the series. overlay adds a second series.
- The timeline above the chart zooms: drag across it, double-click, or pick 1 h, 6 h, 1 day, 7 days.
Node Data
Energy Flow › Node Data. Every bound reading: node, metric, value, last update.
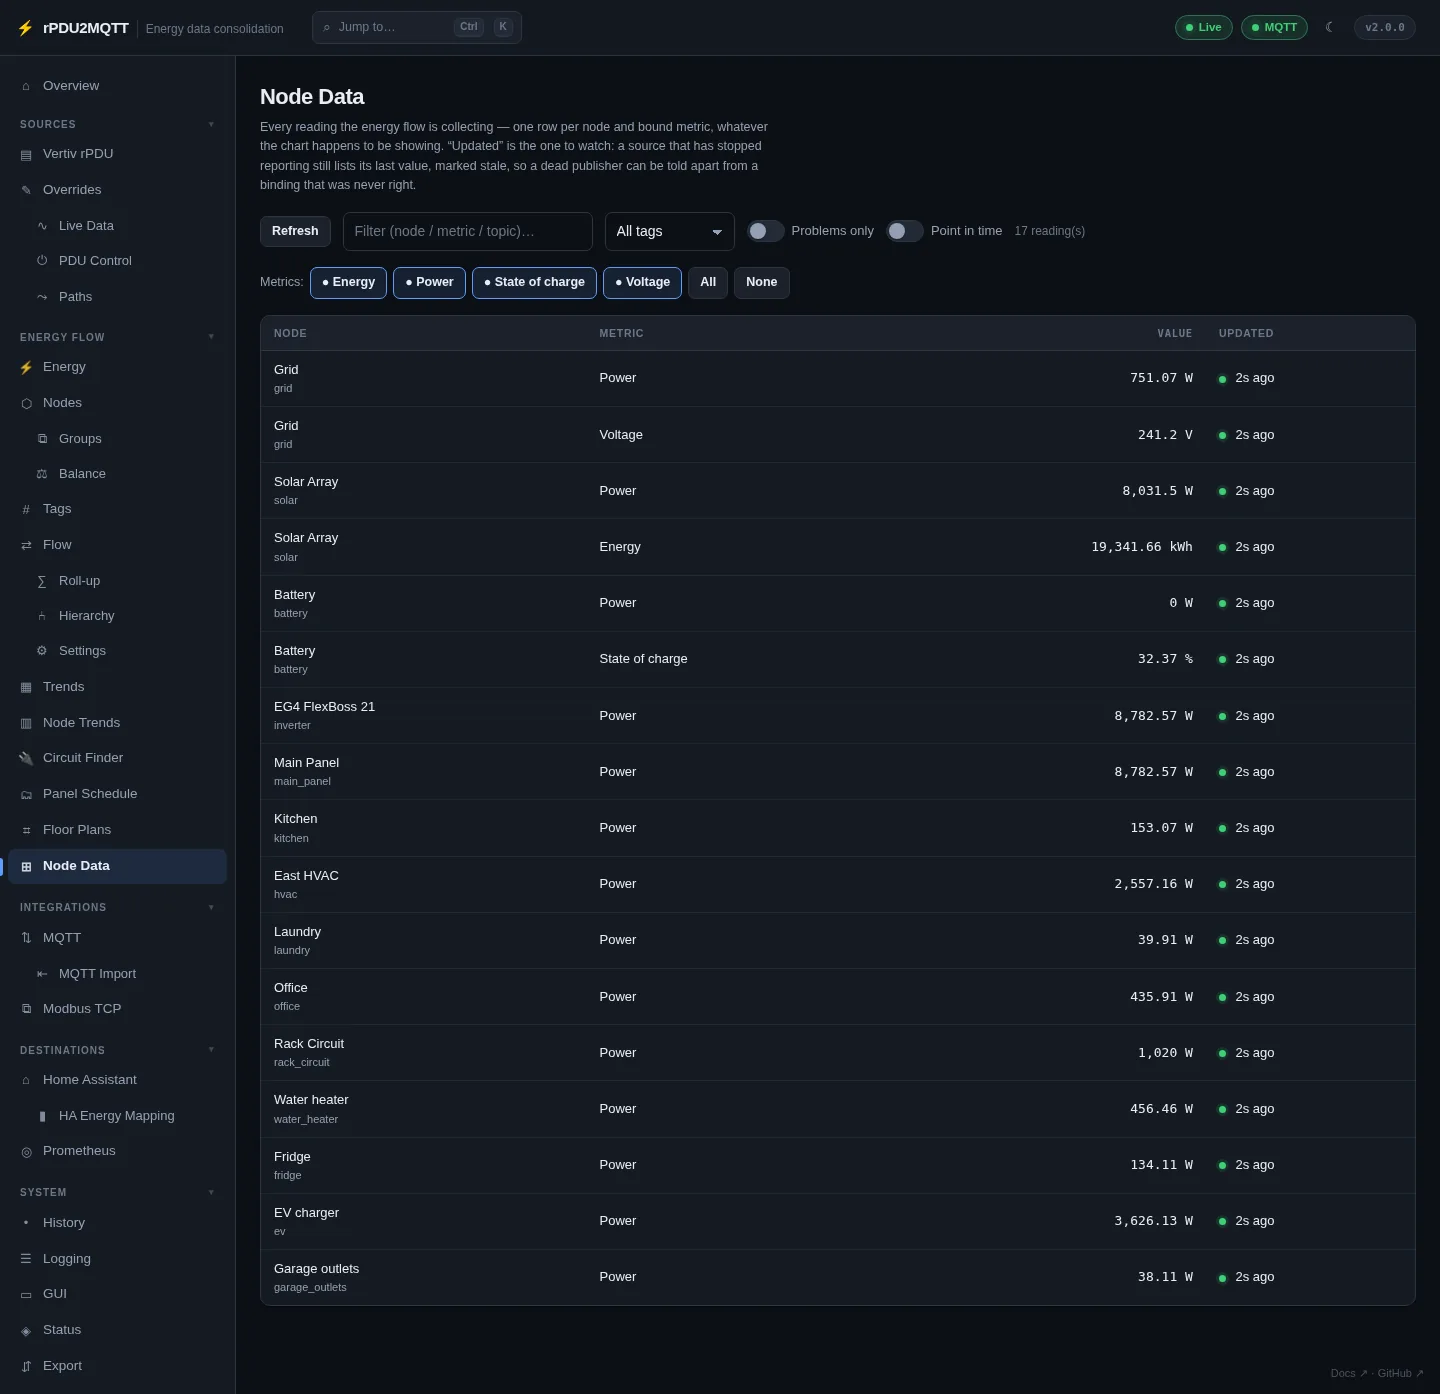
- Problems only shows stale and failing bindings.
- Point in time shows readings at a past moment.
- Filter by text, tag and metric.