Status, Export, Diagnostics
Status
System › Status. One card per source and destination.
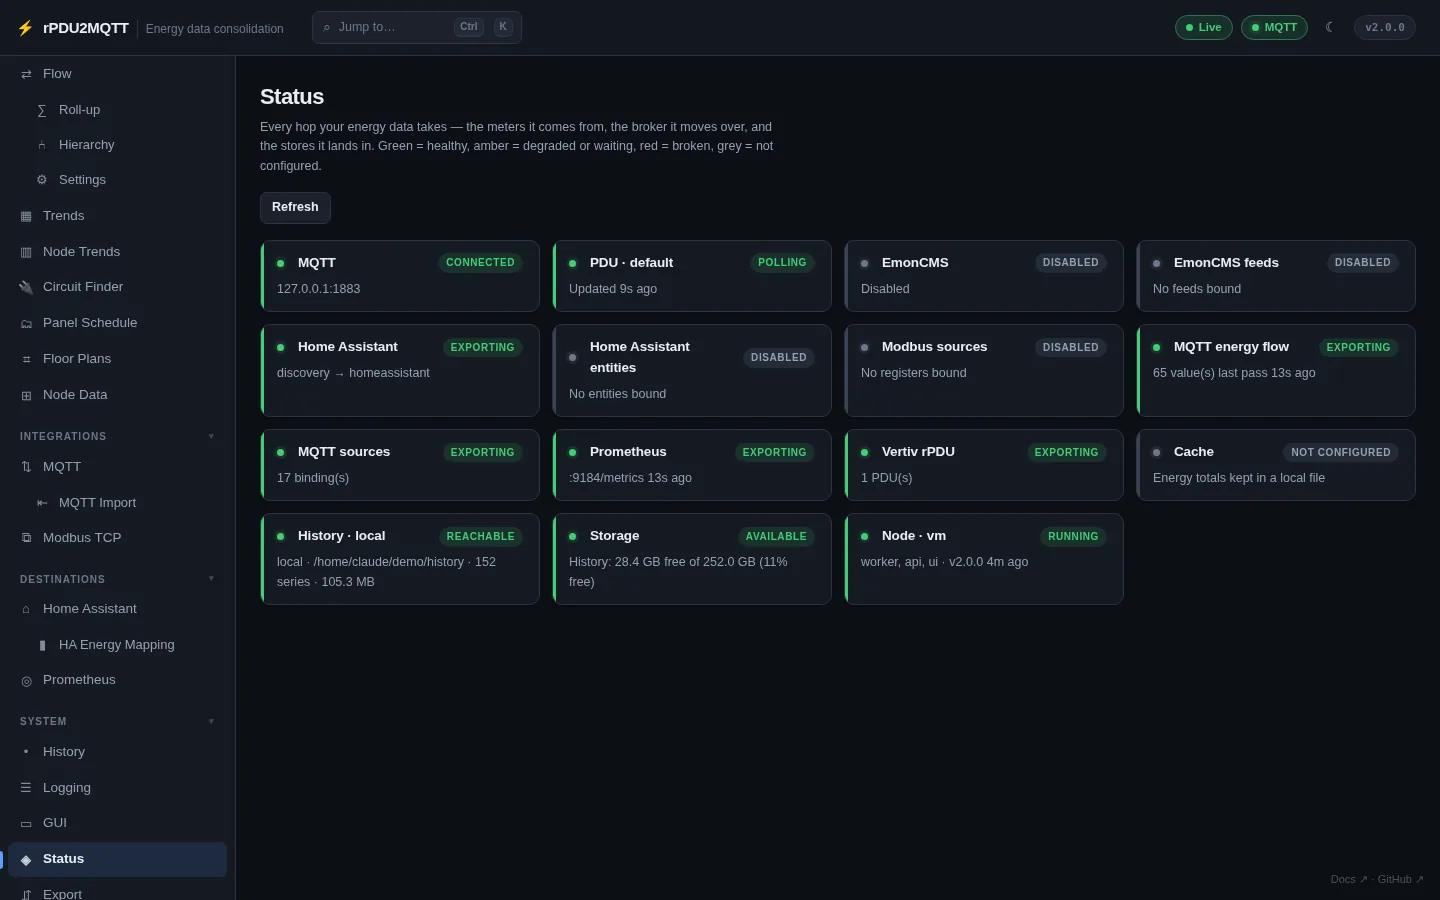
| Colour | Meaning |
|---|---|
| Green | Healthy |
| Amber | Degraded or waiting |
| Red | Broken |
| Grey | Not configured |
Cards: MQTT, each PDU, EmonCMS, EmonCMS feeds, Home Assistant, Home Assistant entities, Modbus sources, MQTT energy flow, MQTT sources, Prometheus, Vertiv rPDU, Cache, History, Storage, and each node (roles, version, uptime).
Storage is red when a directory is missing, read-only or full, amber when under 10% free.
Export
System › Export. Renders the current form, including unsaved edits.
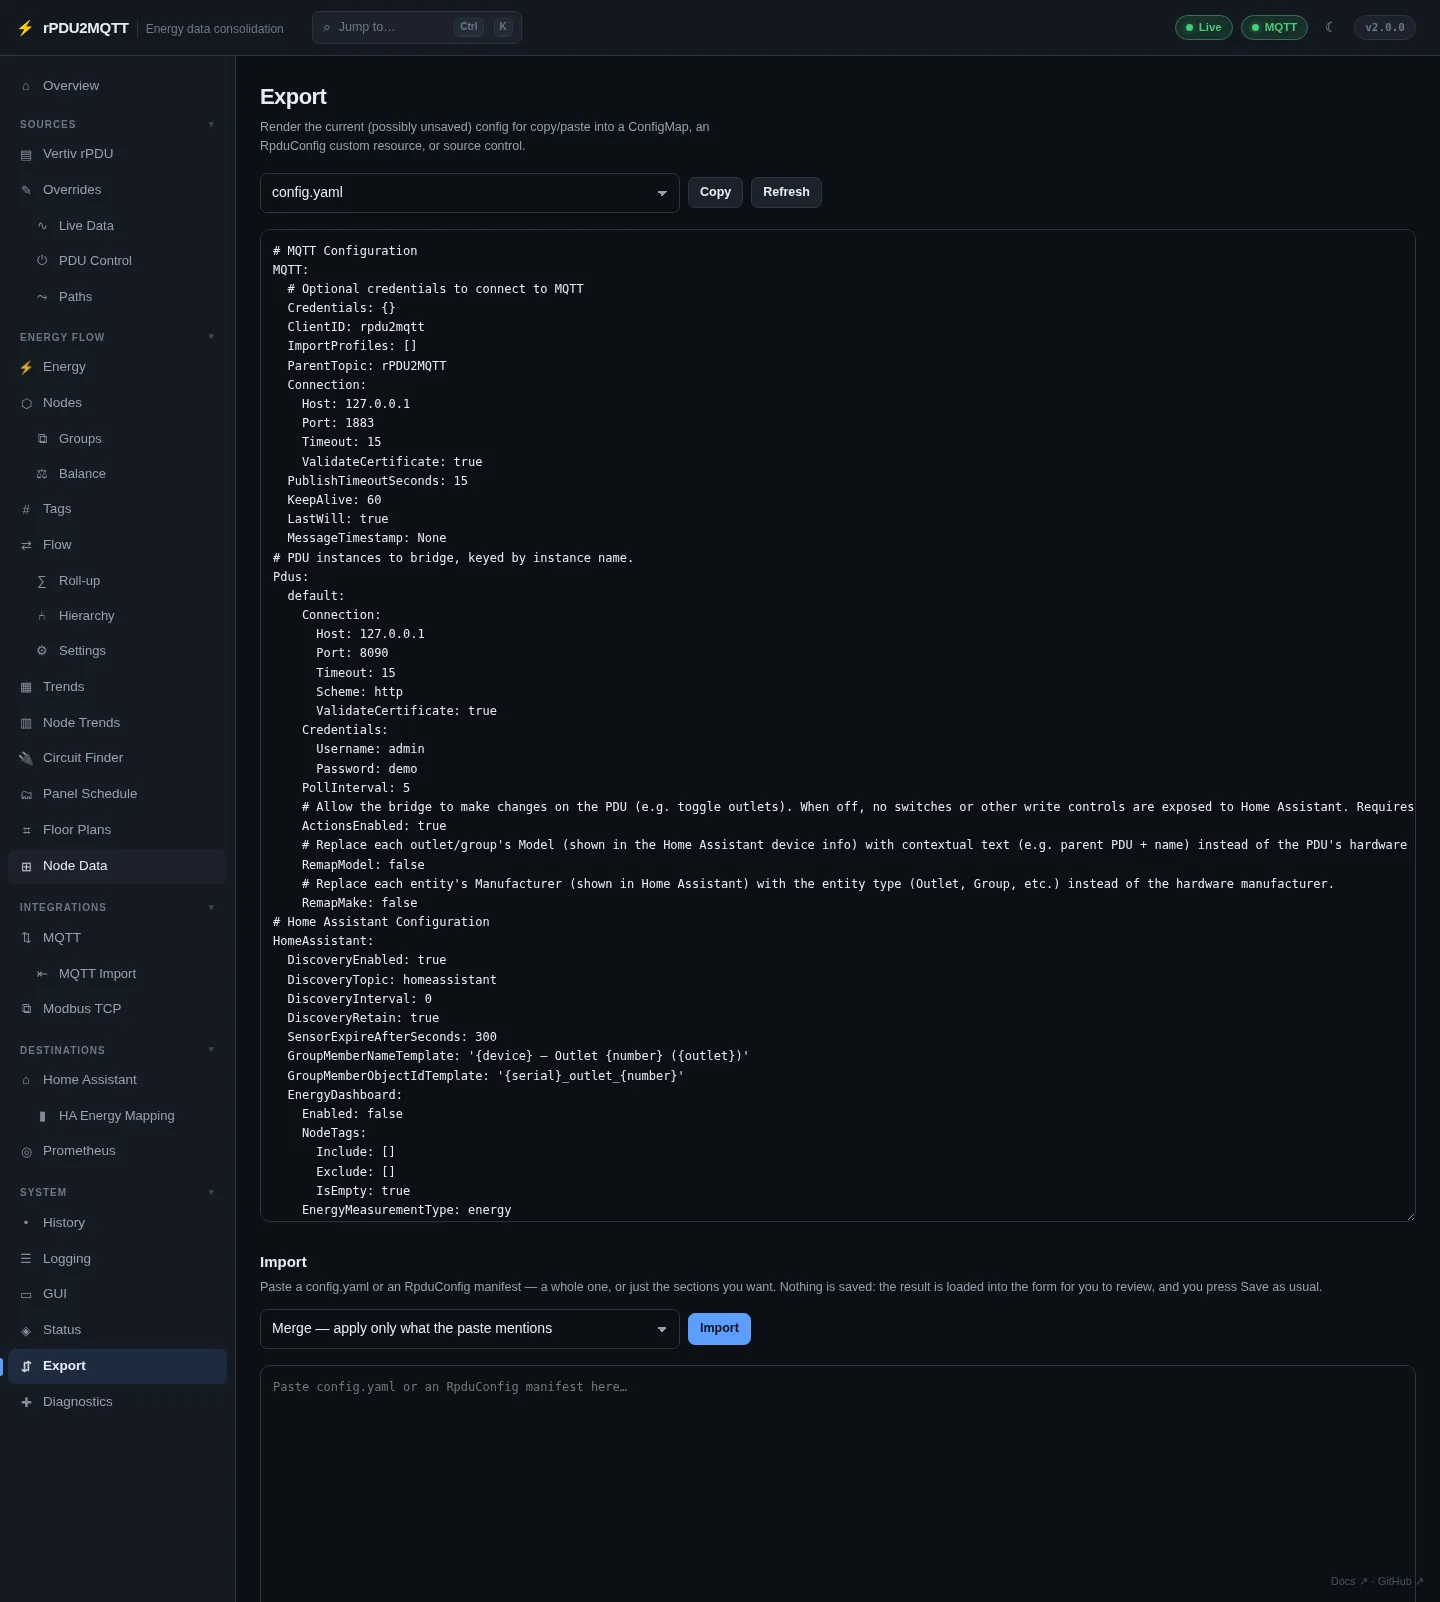
| Control | Action |
|---|---|
| Format | config.yaml or an RpduConfig manifest (secrets redacted) |
| Copy | Copies the output |
| Import › Merge | Applies only the keys in the paste. Lists are replaced whole |
| Import › Replace | The paste becomes the whole config. Unmentioned sections go back to defaults |
Import loads into the form. Press Save to keep it.
Diagnostics
System › Diagnostics.
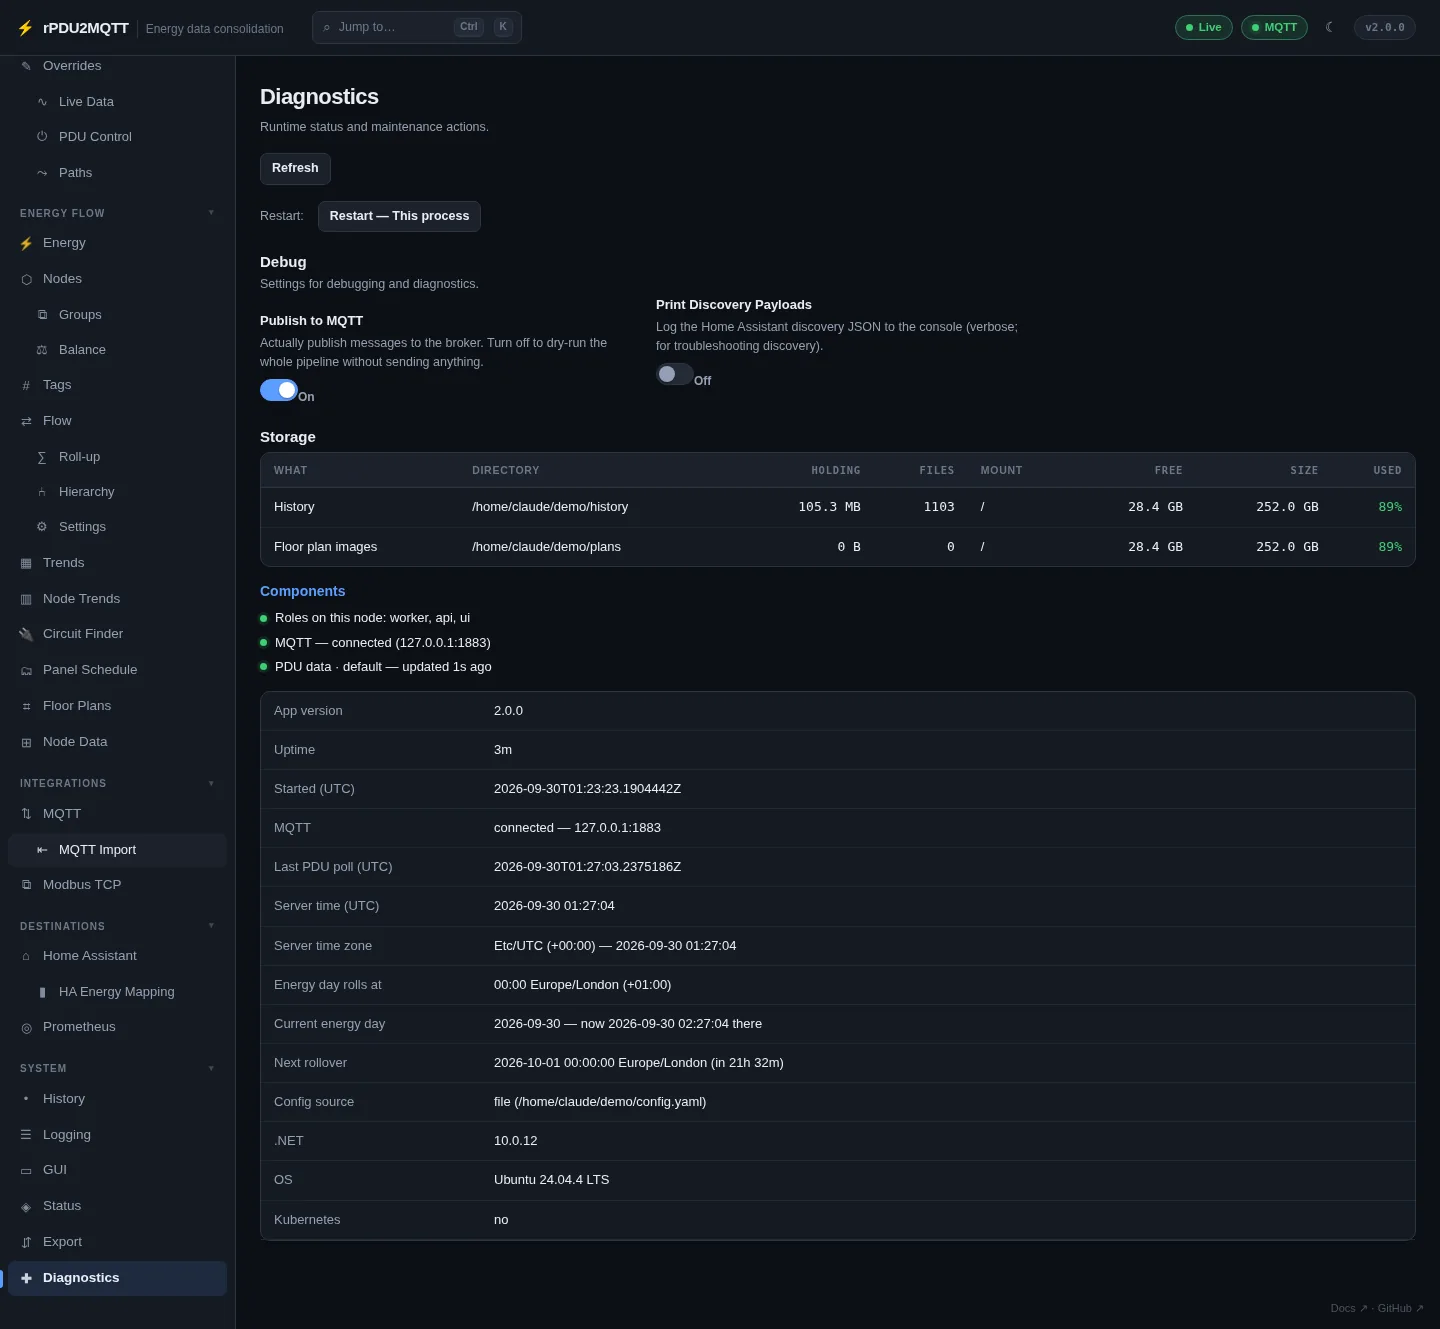
| Section | Contents |
|---|---|
| Restart | Stops the process so the container or host restarts it. Under a leader lease, rolls the Deployment |
| Debug | Publish to MQTT, Print Discovery Payloads (Logging) |
| Storage | Each directory written to: size, files, mount, free space, used % (amber under 10% free, red under 3% or 64 MB) |
| Components | Roles, MQTT connection, last PDU poll |
| Runtime | Version, uptime, time zone, energy day rollover, config source, .NET, OS, Kubernetes |
With the Kubernetes config source, also pod logs and recent events (needs the RBAC the Helm chart grants: pods, pods/log, events).
Operator
Kubernetes only. See Updates and restarts.